
Your dashboard gives you an at-a-glance view of all active (upcoming, live, or on-demand) events in your account.
Account level vs. event level
The dashboard shows a snapshot of every event you have access to. It displays each event's start and end dates, registrant counts, and attendance figures.
Click on any of the events on your dashboard to enter the event configuration portal.
Note: Because administrator access can vary, two people in the same account may see different events — and therefore different totals — on their dashboards.
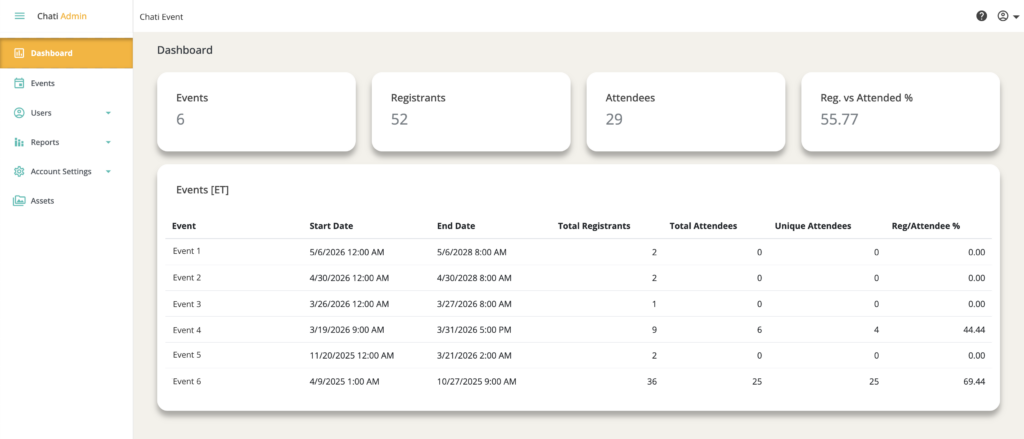
Key Metrics Explained
| Field | Value/Description |
| Start and End Dates | The live event dates only. Preview Period and On-Demand dates are not included. |
| Total Registrants | The unique number of users who registered for the event. |
| Total Attendees | Total login count. If a single user logs in three separate times, they count as 3. |
| Unique Attendees | Unique logins only. If a single user logs in three times, they count as 1. |
| Reg/Attendee % | The overall attendance rate: unique attendees divided by total registrants. |